Forex charts is just like an aerial view of forex market for a particular currency.A better chart understanding makes you able to take right decision before open a position. Once you learn how charts work then no worry to start trading with a right forex broker.
In short forex charts gives you more detail about a currency in forex market. Forex charts is of three types.
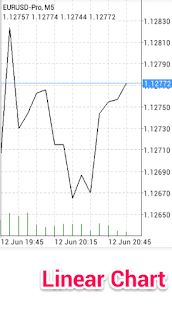
- Line Chart:
It is a simple view of currency movement and shows the open and close price.
It draw a pattern of line as currency price open and close. It also called a linear chart.
 |
| Line-chart |
Currency trend prediction is very difficult in line chart.
- Bar Chart:
Bar chart shows currency movement in vertical line with some extra information as compare to line chart.
These charts are very popular and provide the information of open price, close price, high and low price and also referred as OHLC.
 |
| Bar-chart |
Bar charts gives more data of long period. These shows like a thin vertical lines.Upper most point is high price and lower point is Low price over a given period.
The left horizontal line shows the open price and right horizontal line shows close price over a given time of period.
- Candlestick Chart:
These charts are also OHLC and tells the relation between open and close price in graphical manner. By default it contain vertical body.
 |
| Candlestick |
when price open near the low price and close near the high price, body becomes white.
And when price open near the high and close near the low price, body becomes black.
Candlestick charts is the best and fastest way to understand the trend of market.These charts predict the trend of currency once use with technical indicator.
All forex charts has a best feature that is Time Frame. Trader can predict more accurate forecast for long or short with the help of time frame.
There are time frame period from 1 minute to 1 month. Small time frame generally used for day trading.
And for long term trading trader uses day and month time frames.
So we discussed here Forex charts and their features.
Once you become familiar with charts then you will automatically feel the importance of charts in forex trading.

No comments:
Post a Comment